Statistics and Threat Intelligence
POSTED BY NIR YOSHAThe joke is that “12 out of 10 Americans don’t believe in statistics.” But we still use statistics when looking at Amazon rating scores, watching the weather forecast, or during election cycles. Personally, I have always loved statistics. To me, statistics has that magical power that helps me look at things in a clear way. It makes me feel like I can see into the future (or at least forecast it with 95% confidence). As in other fields, statistics can play an important role in threat intelligence processing.
If you don’t measure threat information statistics, how can you manage or optimize your use of threat intelligence? Just like in other sides of your business, if you aren’t measuring performance, you may be missing opportunities. When it comes to how threat intelligence performs, you may be missing opportunities to reduce false positives and improve security effectiveness.
Why Statistics? George Santayana once said, “Those who do not remember the past are condemned to repeat it.” Statistics is much about “understanding and analyzing the past” in order to bring valuable insights into what is and isn’t working. Since threat intelligence is about evidence data coming from past attacks that threaten an organization, it sounds like statistics is a good match. Threat intelligence, by definition, has some uncertainty associated with it. Statistics knows how to quantify and assess those uncertainties in an objective and comparable way. Lastly, threat intelligence is partial information and highly depends on forensic evidence and external sources. As such threat analysts make assumptions that can be validated or rejected using statistical methods. In order to apply statistics to threat intelligence effectively, several steps are involved.
1 – Data Preparation Careful data preparation is an essential part of statistical analysis. This step includes data collection, normalization and aggregation. The ThreatQ Platform supports multiple threat intelligence sources and attributes. Many threat intelligence sources are in fact threat information sources, providing unfiltered information that should be processed and analyzed before even letting statistics get into the door.
The ThreatQ Platform helps transform information into threat intelligence by adding relevant context and enrichment. For example, enrichment tools using normalization and cross-correlation can help explain whether an IP address relates to an APT 28 Spear Phishing attempt or a Deep Panda connection back to C2. As a result of getting the right context, appropriate action can be taken.
2 – Data Classification Once the data preparation step is done, data classification is the process of organizing data into categories for its most effective and efficient use. A well-planned data classification strategy makes it easy to find and retrieve data for statistics and other purposes. Here are a few examples of classification criteria and the reasons behind them:
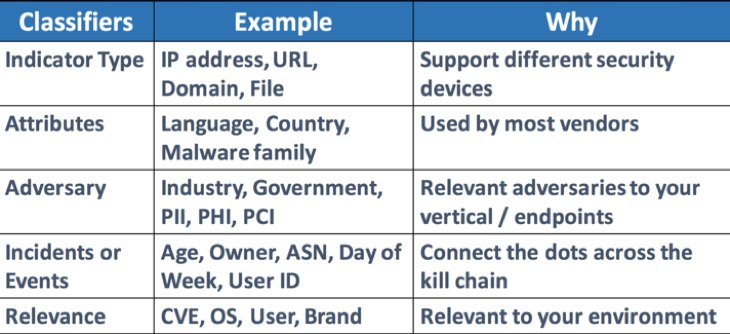
Figure 1 – Suggested Classifiers
3 – Data Validation Data validation is the process of ensuring that data have undergone data cleansing to ensure they have data quality, that is, that they are both correct and useful. In threat intelligence, confidence is part of data validation. It is usually graded with a scale of low, mid and high confidence levels which can change over time based on new evidence. In statistics, confidence is a much more measurable and meaningful term. It is the percentage covered area under the distribution curve (Figure 2).
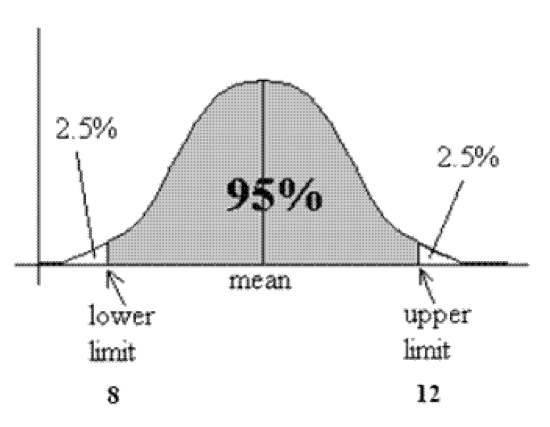
Figure 2 – Confidence = Area under the distribution curve
A margin of error tells you how many percentage points your results will differ from the real population value, so margin of error and confidence interval are highly related. The larger the margin of error, the less confidence one should have that reported threat information is a “true” figure.
4 – Data Correlation Correlation is a technique for investigating the relationship between two variables, for example, malware and adversary. Correlation in threat intelligence helps identify links between pieces of information. Conditional probability helps not only understanding your data, but also coming up with actionable insights. Conditional probability looks at two or more dependent events. For example, the probability of a successful exploit of vulnerability X enabling a successful spear phishing attack on company Y.

Figure 3 – Venn diagram for conditional probability
Let’s look at 100 incident investigations where the probability of a spear phishing attack vector being used as a delivery mechanism is 40% and the probability of using an Android exploit is 30%.
P(A|B) is the probability of an incident using an Android exploit given the delivery method was spear phishing. In our case P(A|B) = 0.3×0.4/0.4 = 0.3, which is 30%
Looking at correlation and calculating conditional probability of a certain chain of events can help the security team invest resources in the right places and identify the total risk of a threat in a more scientific way.
5 – Data Scoring Scoring threat information over time can help identify what data is important based on location, industry, adversary and other criteria. Statistics helps evaluate and validate the scoring in order to improve it over time. Scoring threat intelligence sources might change over time as vendors change the quality and type of threat information provided. For example, a score between 1-10 can generate a priority list of threat intelligence for threat analysts. In order to validate the scoring one can use the sensitivity and specificity test. Looking at a sample of threat information scored between 1 to 10, we can look at a cutoff score of 6.5. Any valuable threat information scored under 6.5 will be considered false negative. Any non-valuable threat information scored over 6.5 will be considered false positive.
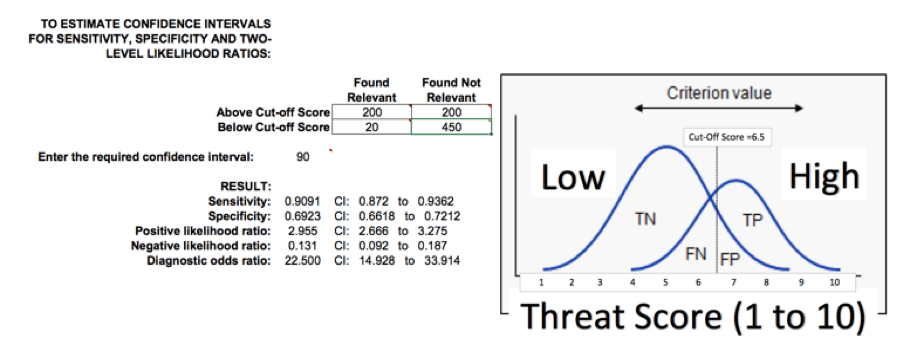
Figure 4 – Scoring sensitivity and specificity test
Sensitivity indicates the probability that a score over the cut-off will correctly identify valuable threat information. Specificity indicates the probability that a score under the cut-off will correctly identify non-valuable information. Modifying score criteria or cut-off score can help reduce false positives.
Conclusion Security analysts must be very quick and accurate in decision making. One of the biggest challenges of threat intelligence is the number of false positives and noisy datasets analysts must deal with. Statistics play an important role in threat intelligence processing and reporting. Probability and confidence level can help reduce the noise and prioritize threat-related activities. As threat intelligence datasets continue growing, statistics and data science will become a necessity for threat intelligence analysts. Threat intelligence teams should consider statistics tools to improve their findings and present their results in a more meaningful way.

0 Comments